How Much Electricity Does a Wind Turbine Produce Per Day?
A residential wind turbine produces 5-30 kWh per day depending on turbine size and local wind speed. Learn what affects daily output and how to estimate production for your site.
Share this article
windturbinehome.com/s/780dc7

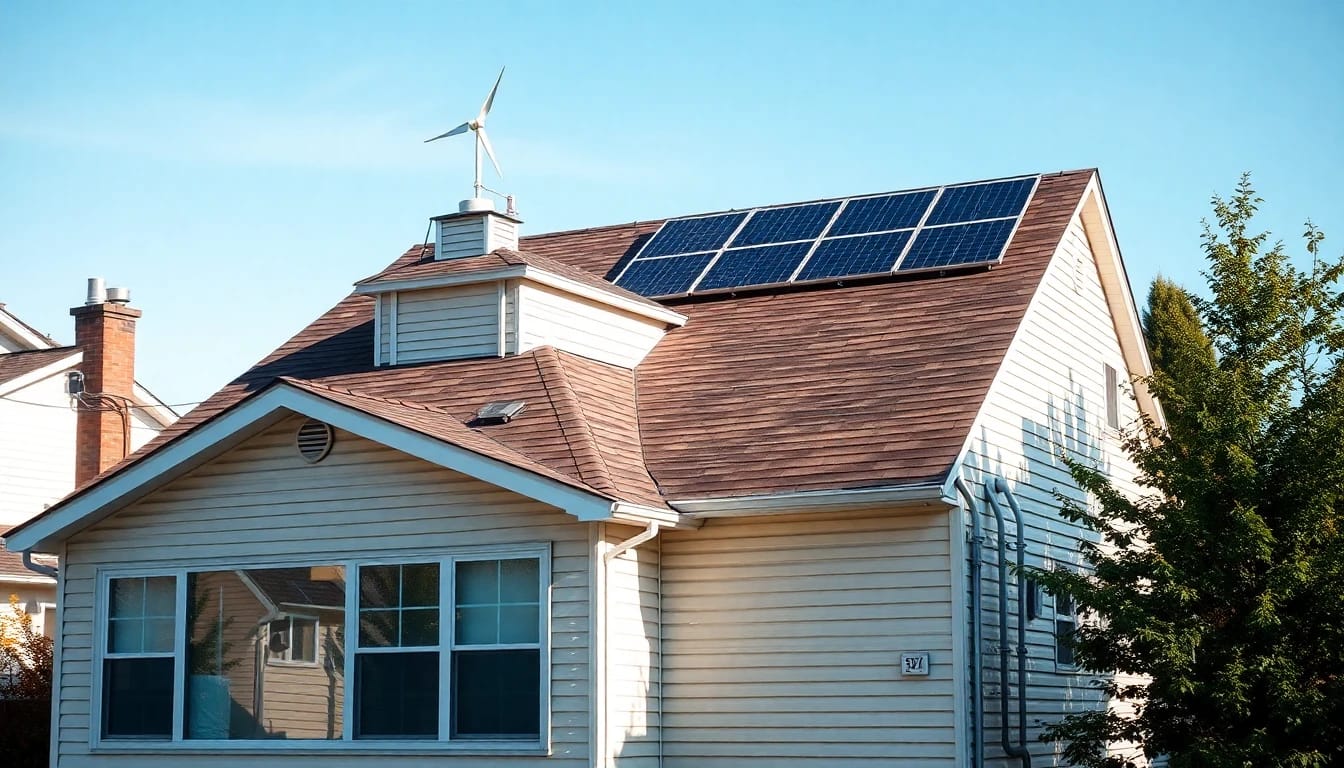
!A residential wind turbine spinning against a blue sky with anemometer showing wind speed, illustrating daily electricity generation
A typical residential wind turbine produces between 5 and 30 kilowatt-hours (kWh) of electricity per day, depending on turbine rated capacity and average wind speed at the installation site. A 1.5 kW turbine in a location averaging 12 mph wind speeds generates roughly 5-8 kWh daily, while a 10 kW unit in a 14 mph average site produces 20-30 kWh. The average U.S. household consumes approximately 30 kWh per day, meaning a properly sized and sited turbine can offset a substantial portion of residential electricity demand.
What determines daily wind turbine output
Three factors control how much electricity a residential wind turbine produces each day: the turbine's rated capacity, local wind speed, and site-specific conditions that affect wind flow.
Rated capacity represents the maximum power output a turbine can generate under ideal conditions, typically measured at a specific wind speed (often 25-30 mph for small turbines). A Bergey Excel 10 carries a 10 kW rating, while a Primus Air 40 rates at 1.5 kW. This number appears in manufacturer specifications but rarely reflects real-world daily generation.
Wind speed matters more than turbine size. Power output increases with the cube of wind speed—doubling wind velocity increases potential power eightfold. A site averaging 12 mph produces dramatically less than one averaging 16 mph, even with identical turbines. The Department of Energy's WINDExchange program emphasizes that assessing local wind resources represents the single most critical step before purchasing equipment.
Site-specific factors include tower height, terrain features, nearby obstructions, and seasonal wind patterns. A turbine mounted on a 100-foot tower in open farmland captures far more energy than the same unit on a 40-foot pole behind a two-story house.

Daily output by turbine size and wind speed
Real-world production data reveals wide variation based on equipment and location. These estimates assume properly sited installations on towers tall enough to clear local obstructions by at least 30 feet.
| Turbine Size | Average Wind Speed | Estimated Daily Output | Annual Production |
|---|---|---|---|
| 1 kW | 10 mph | 2-4 kWh | 730-1,460 kWh |
| 1 kW | 14 mph | 4-6 kWh | 1,460-2,190 kWh |
| 2.5 kW | 10 mph | 5-8 kWh | 1,825-2,920 kWh |
| 2.5 kW | 14 mph | 10-15 kWh | 3,650-5,475 kWh |
| 5 kW | 10 mph | 8-12 kWh | 2,920-4,380 kWh |
| 5 kW | 14 mph | 18-25 kWh | 6,570-9,125 kWh |
| 10 kW | 10 mph | 12-18 kWh | 4,380-6,570 kWh |
| 10 kW | 14 mph | 25-35 kWh | 9,125-12,775 kWh |
Manufacturer-specified production estimates often assume higher average wind speeds than most residential sites experience. Independent testing and owner-reported data typically show 60-75% of advertised figures under normal operating conditions.
The residential wind turbine sizing guide provides detailed calculations for matching turbine capacity to household consumption patterns and local wind resources.
How wind speed varies throughout the day
Wind patterns follow predictable daily and seasonal cycles that directly affect electricity generation. Most locations experience stronger winds during afternoon hours as solar heating creates thermal gradients, with calmer conditions overnight and early morning.
Coastal sites often see reliable afternoon sea breezes, while Great Plains locations experience stronger overnight winds driven by low-level jets. Mountain and ridge-top installations benefit from terrain-induced acceleration but face extreme turbulence that reduces turbine lifespan.
Seasonal variation compounds daily fluctuation. Northern states typically see higher winter wind speeds when heating loads peak, creating favorable economics. Southern locations may experience lower winter winds precisely when demand increases.
Data logging over 12 months before purchasing equipment reveals these patterns. The Department of Energy's Small Wind Guidebook recommends collecting wind data at the proposed tower height for at least one full year, though three months during the windiest season provides useful preliminary information.

Calculating expected production for your site
Estimating daily electricity generation requires three inputs: average wind speed at hub height, turbine power curve data, and capacity factor assumptions.
Wind speed at hub height differs substantially from ground-level measurements. The wind shear coefficient describes how velocity increases with elevation, typically ranging from 0.14 (smooth terrain) to 0.4 (suburban areas with numerous obstructions). A location measuring 10 mph at 30 feet might see 13-14 mph at 80 feet in open country.
Power curves plot turbine output against wind speed. Manufacturers provide these graphs showing cut-in speed (minimum wind for generation, typically 6-8 mph), rated speed (wind velocity producing maximum output, often 25-30 mph), and cut-out speed (when turbines shut down for safety, usually 45-55 mph). Real production follows this curve across the range of speeds a site experiences.
Capacity factor represents actual production as a percentage of theoretical maximum if the turbine ran at rated power 24/7. Residential installations typically achieve 10-30% capacity factors depending on wind resource quality. A 5 kW turbine with a 20% capacity factor produces 24 kWh daily (5 kW × 24 hours × 0.20), while the same unit at a 30% site generates 36 kWh daily.
The wind turbine power output calculator automates these calculations using National Renewable Energy Laboratory (NREL) wind resource maps and manufacturer power curves.
Why daily output matters less than monthly and annual production
Daily generation figures fluctuate wildly with weather patterns, making them unreliable for planning. A single storm system might deliver a week's worth of electricity in 48 hours, followed by three calm days producing nearly nothing.
Monthly totals smooth these variations while revealing seasonal trends. A turbine averaging 15 kWh daily might produce 650 kWh in March, 350 kWh in August, and 550 kWh in November. Annual production provides the most meaningful metric for economic analysis and system sizing.
Grid-tied installations benefit from net metering, which credits excess production to offset consumption during low-wind periods. This arrangement transforms irregular daily output into steady annual savings. The net metering policies by state guide explains how different states handle renewable energy credits.
Off-grid systems require battery storage to bridge calm periods, adding substantial cost and complexity. Daily production variability drives battery bank sizing—a week of autonomy demands batteries capable of storing 7 days × daily consumption, even if the turbine produces that much energy over a month. The off-grid wind power battery systems article details storage requirements.

Comparing wind production to solar generation
Wind and solar follow complementary generation patterns. Solar panels produce peak power during midday when irradiance peaks, then nothing overnight. Wind turbines often generate more electricity during evening and overnight hours when winds strengthen.
Seasonal patterns also differ. Solar production peaks in summer with long days and high sun angles, while many regions experience stronger winter winds. A hybrid renewable system combining both technologies achieves more consistent year-round generation than either alone.
Daily output per installed watt favors wind in locations with average speeds above 12 mph. A 5 kW turbine in a 14 mph site generates 20-25 kWh daily, while 5 kW of solar panels (approximately 12-15 panels) produce 15-25 kWh depending on latitude and sun exposure. Wind equipment costs less per rated watt but requires expensive towers and installation, often equalizing total system price.
The wind vs solar for home power comparison analyzes lifecycle costs and production profiles for different regions.
Real-world production examples by turbine model
Verified owner data provides realistic expectations beyond manufacturer claims. These figures represent long-term averages from properly installed systems in suitable locations.
Bergey Excel 10 (10 kW rated): Installations in 12-14 mph average sites typically produce 18-28 kWh daily (6,500-10,200 kWh annually). One Montana rancher reported 32 kWh daily average over 5 years in a 16 mph location, while an Ohio installation averaged 14 kWh daily in 11 mph winds.
Primus Air 40 (1.5 kW rated): Owner-reported data shows 3-7 kWh daily production in 10-14 mph sites. A Vermont homeowner averaged 4.2 kWh daily over three years, offsetting roughly 15% of household consumption.
Skystream 3.7 (discontinued, but many remain operational): This 1.9 kW turbine generated 5-10 kWh daily in moderate wind sites. Production data from over 1,000 installations showed significant variation, with best-performing units in Great Plains locations averaging 12-14 kWh daily.
Aeolos-V 5kW: Field reports indicate 10-20 kWh daily in 12-14 mph average conditions. A Texas installation logged 18 months of data averaging 16.3 kWh daily with a 28% capacity factor.
Underperformance relative to manufacturer estimates stems from real-world wind resource variability, suboptimal siting, grid outages requiring turbine shutdown, and maintenance downtime. Planning for 70% of advertised production creates realistic financial projections.
Installation factors that affect daily generation
Proper installation determines whether a turbine achieves its production potential. Tower height represents the single most important decision after turbine selection.
The Department of Energy recommends towers at least 30 feet above any obstruction within 500 feet. A house, barn, or mature tree 40 feet tall requires an 80-foot tower for optimal performance. Shorter towers save money upfront but sacrifice 30-50% of potential production, destroying project economics.
Tower type affects cost and performance. Monopole towers offer excellent rigidity with minimal wind shadow but require professional installation and often crane rental. Tilt-up towers enable DIY maintenance but create turbulence that slightly reduces output. Guyed lattice towers provide the most economical height but require substantial land area for guy wire anchors.
Turbine orientation matters for vertical-axis designs, which some manufacturers claim are omnidirectional. Real-world testing shows 10-20% production gains from positioning vertical-axis turbines with prevailing wind direction for turbulent residential sites.
All electrical interconnections must comply with NEC Article 705 covering grid-tied renewable systems. Licensed electricians familiar with wind installations ensure proper grounding, overcurrent protection, and utility interconnection. Substandard electrical work creates fire hazards and voids equipment warranties.
FAA Part 77 notification applies to any structure exceeding 200 feet above ground level, though local airport proximity may trigger review for shorter towers. The wind turbine permitting and regulations guide covers zoning, setbacks, and aviation requirements.
Understanding capacity factor and availability
Capacity factor measures actual production against theoretical maximum. A 5 kW turbine running at rated power 24/7 would generate 120 kWh daily. Real turbines produce 12-36 kWh daily, creating capacity factors of 10-30%.
Excellent wind sites (Class 4+, averaging 14+ mph at 80 feet) support 25-30% capacity factors. Good sites (Class 3, 12-14 mph) yield 18-25%. Marginal sites below 12 mph average rarely exceed 15% and generally fail economic viability tests.
Availability describes the percentage of time equipment operates when wind is sufficient. Well-maintained turbines achieve 95-98% availability, with downtime for scheduled maintenance and occasional repairs. Grid outages force turbine shutdown on most residential systems for safety, reducing effective availability in areas with unreliable utility service.
The combination of capacity factor and availability determines long-term production. A turbine with 25% capacity factor and 95% availability produces approximately 23.75% of theoretical maximum over its lifetime.
Optimizing production through monitoring and maintenance
Modern grid-tied inverters and charge controllers include production monitoring, revealing performance trends and identifying problems before they escalate.
Daily monitoring catches sudden output drops indicating blade damage, bearing wear, or electrical faults. A turbine consistently producing 20 kWh daily that suddenly drops to 12 kWh needs inspection. Gradual decline over months may indicate blade erosion or gearbox wear requiring maintenance.
Quarterly visual inspections check guy wire tension, tower condition, and blade integrity. Annual professional service includes gearbox oil changes (if equipped), electrical connection inspection, and bolt torque verification. Manufacturers specify maintenance schedules; following them preserves warranties and maximizes output.
Bird strikes, lightning, and icing reduce production in specific regions. Lightning protection systems add $500-1,500 but prevent catastrophic failure in thunderstorm-prone areas. Blade heating systems combat ice accumulation in northern climates, maintaining winter production when heating loads peak.
Production data feeds into the IRS Form 5695 calculations for claiming the 30% Residential Clean Energy Credit under IRC §25D, which applies to small wind systems placed in service through 2032. Detailed generation records substantiate the credit if audited.

How daily production translates to utility bill savings
Net metering converts daily kilowatt-hours into bill credits at retail electricity rates. A turbine producing 20 kWh daily in a state with $0.14/kWh electricity costs generates $2.80 daily savings, or roughly $1,000 annually.
Time-of-use rates enhance savings when wind production coincides with expensive peak periods. Evening wind generation during 4-9 PM peak hours earns $0.25-0.40/kWh credits in some California markets, doubling the value of the same kilowatt-hours.
Fixed monthly grid connection charges typically remain regardless of wind production. A household reducing consumption to zero still pays $15-40 monthly for meter service and grid access in most utility territories.
State policies vary dramatically. DSIRE (Database of State Incentives for Renewables & Efficiency) tracks net metering availability, renewable energy credits, and state tax incentives. Some states pay wholesale rates ($0.03-0.05/kWh) for excess production instead of retail rates, drastically changing project economics.
The wind turbine return on investment calculator models savings scenarios across different utility rate structures and state policies.
When daily production doesn't meet expectations
Underperforming turbines frustrate owners who invested substantial capital expecting manufacturer-projected generation. Several fixable issues explain most shortfalls.
Incorrect wind resource assessment leads many problems. Estimating wind speed from trees or using airport weather station data instead of on-site measurement produces wildly optimistic projections. A 14 mph average site predicted from airport data 20 miles away may actually experience 10 mph winds, cutting production nearly in half.
Turbulence from nearby obstacles destroys efficiency even when average wind speed seems adequate. A turbine 60 feet above ground but only 20 feet above a neighboring barn operates in chaotic airflow that prevents blades from capturing energy efficiently.
Equipment defects occasionally occur. Bearings seizing prematurely, blades poorly balanced from the factory, or inverter firmware limiting power output show up in production data. Warranty claims require documentation demonstrating the turbine underperforms relative to measured wind speeds and manufacturer power curves.
Lowered expectations based on actual site conditions help. A turbine producing 70% of manufacturer estimates may actually be performing well given real wind resources and site constraints.
How many kWh does a 5kW wind turbine produce per day?
A 5 kW residential wind turbine produces 8-25 kWh daily depending on average wind speed at hub height. Sites averaging 10 mph generate 8-12 kWh daily, while 14 mph locations produce 18-25 kWh. Actual output varies day-to-day with weather, making monthly totals more useful for planning. Capacity factors of 15-25% are typical, meaning 5 kW turbines rarely generate the theoretical maximum of 120 kWh daily.
Can a small wind turbine power a house?
A properly sized small wind turbine on a suitable site can offset 30-100% of residential electricity consumption. The average U.S. home uses 30 kWh daily, requiring a 7-10 kW turbine in 12+ mph average winds for full offset. Grid-tied installations use utility power when wind is insufficient and export excess during high production. Off-grid applications require battery storage to bridge calm periods, significantly increasing system cost and complexity.
What wind speed produces the most electricity?
Most residential wind turbines generate maximum rated power at 25-30 mph, though production increases with velocity up to cut-out speed (45-55 mph). However, moderate steady winds of 15-20 mph produce more total daily energy than occasional storms because they occur more frequently. The cubic relationship between wind speed and power means a site averaging 14 mph generates far more annual electricity than one averaging 10 mph with occasional 25 mph gusts.
How long does a wind turbine run per day?
Wind turbines operate whenever wind speed exceeds cut-in threshold (typically 6-8 mph) and remains below cut-out speed (45-55 mph). In moderate wind sites, turbines may spin 12-18 hours daily but only generate significant power 6-10 hours when winds exceed 10-12 mph. Grid-tied systems shut down during utility outages for safety, reducing daily runtime. Maintenance downtime averages 2-5% annually for well-maintained residential units.
Is 10 mph wind enough for electricity generation?
Ten mph average wind speed represents the minimum threshold for viable residential wind power generation. Turbines begin producing electricity at 6-8 mph cut-in speed, but output remains minimal until winds reach 10-12 mph. Sites averaging 10 mph yield capacity factors of 10-15%, generating roughly one-third the electricity of 14 mph locations. The Department of Energy recommends 11+ mph average annual wind speed (at hub height) for residential installations to achieve reasonable economics.
Bottom line
A residential wind turbine's daily electricity production ranges from 5-30 kWh depending on equipment size and local wind resources, with average sites supporting 15-20 kWh daily output from properly sized systems. Annual production matters more than daily fluctuation when evaluating economics and sizing equipment to household consumption. Before purchasing any turbine, measure wind speed at the proposed tower height for at least three months—preferably 12—using calibrated equipment, then consult the small wind turbine buyer's guide to match turbine capacity to verified site conditions and electricity needs.
Share this article
windturbinehome.com/s/780dc7
Editorial note: This article was researched and written by a member of the Wind Turbine Home editorial team. AI-assisted tools were used for spell-checking and light grammar review only — all research, analysis, and conclusions are our own. Our editorial policy prohibits sponsored content and paid placements. Read our editorial policy →
Related reading
residential wind power
Home Wind Turbine: A Comprehensive US Buyer's Guide 2024
Explore the realities of owning a home wind turbine in the US, covering costs, energy output, installation requirements, and available federal and state incentives for homeowners considering small-scale wind power.
residential wind power
Home Wind Turbine Systems: A Complete 2024 Buyer's Guide
Explore the realities of a home wind turbine system for residential power, covering installation, costs, grid-tie considerations, and US federal incentives.

residential wind power
First-Year Mistakes New Home Wind Turbine Owners Regret Most
New home wind turbine owners make costly first-year errors—from poor site assessment to skipping permits. Learn the eleven most common mistakes and how to avoid them.

residential wind power
Grid-Tied vs Battery-Backed Wind Turbine Systems for Homes
Grid-tied systems feed excess wind power directly to the utility for credits, while battery-backed configurations store energy for outages and off-grid use.

residential wind power
How to Right-Size a Wind Turbine for Your House in 2025
Match your home wind turbine to your actual energy use and site conditions. Learn the sizing formula, power curves, and common mistakes to avoid before you buy.

residential wind power
Best Wind Turbines for Australian Homes: STCs, AS/NZS 3000 & Top Picks
Small wind turbines for Australian homes can qualify for STCs under the SRES, but few models meet AS 4509.1 standards. Compare Bergey, Primus, and proven vertical-axis turbines.

residential wind power
Best Wind Turbines Under $5000 for Home Use (2026 Guide)
Compare the top small wind turbines under $5000 for residential use in 2026. Real performance data, installation costs, and ROI analysis for US homeowners.
residential wind power
Best Wind Turbines for Iowa Homes: 2025 Buyer's Guide
Iowa's average 30m wind speeds of 5.5-7.5 m/s make residential turbines highly viable. Compare Bergey Excel 10, Primus AIR 40, and VAWT options for grid-tied or off-grid systems.

residential wind power
Best Wind Turbines for Texas Homes: 2025 Buyer's Guide
Texas homeowners can generate clean power with small wind turbines rated 1-10 kW. Learn which models work best in Texas wind zones, plus costs and incentives.