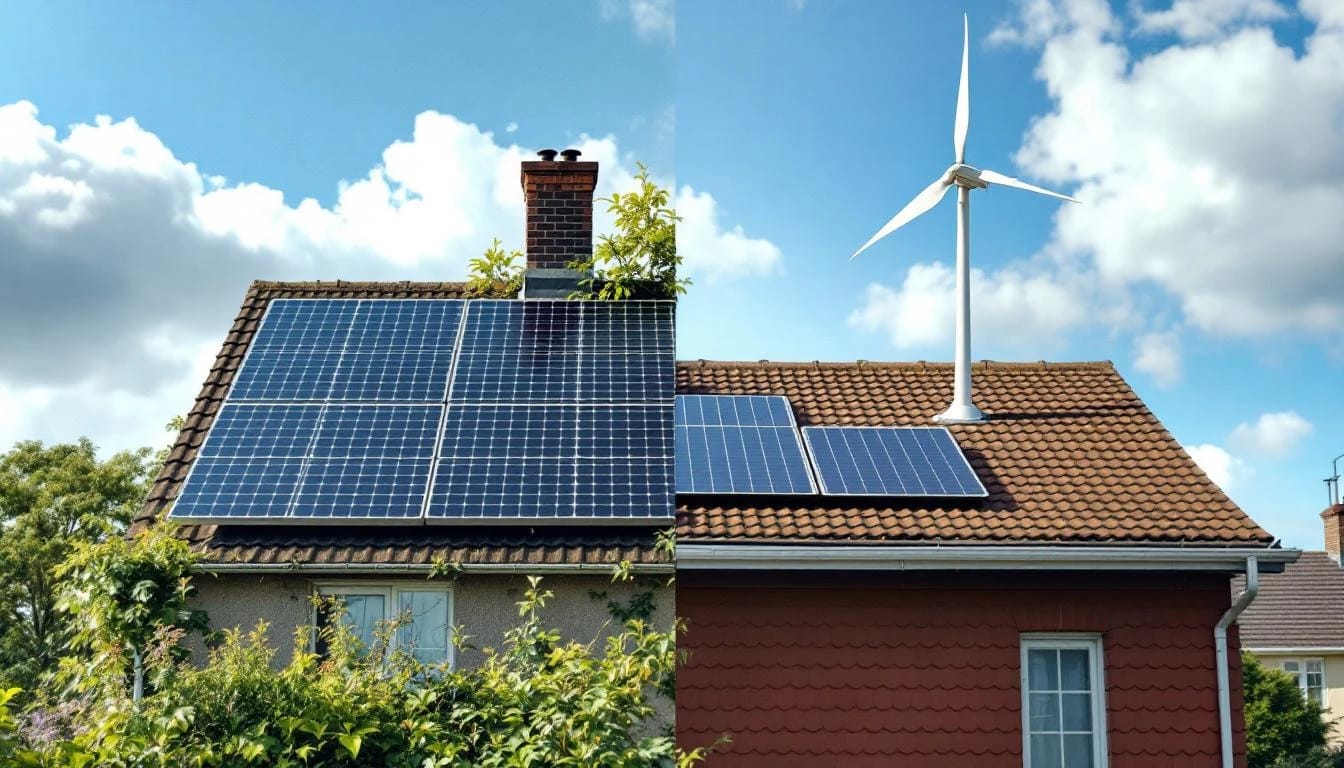
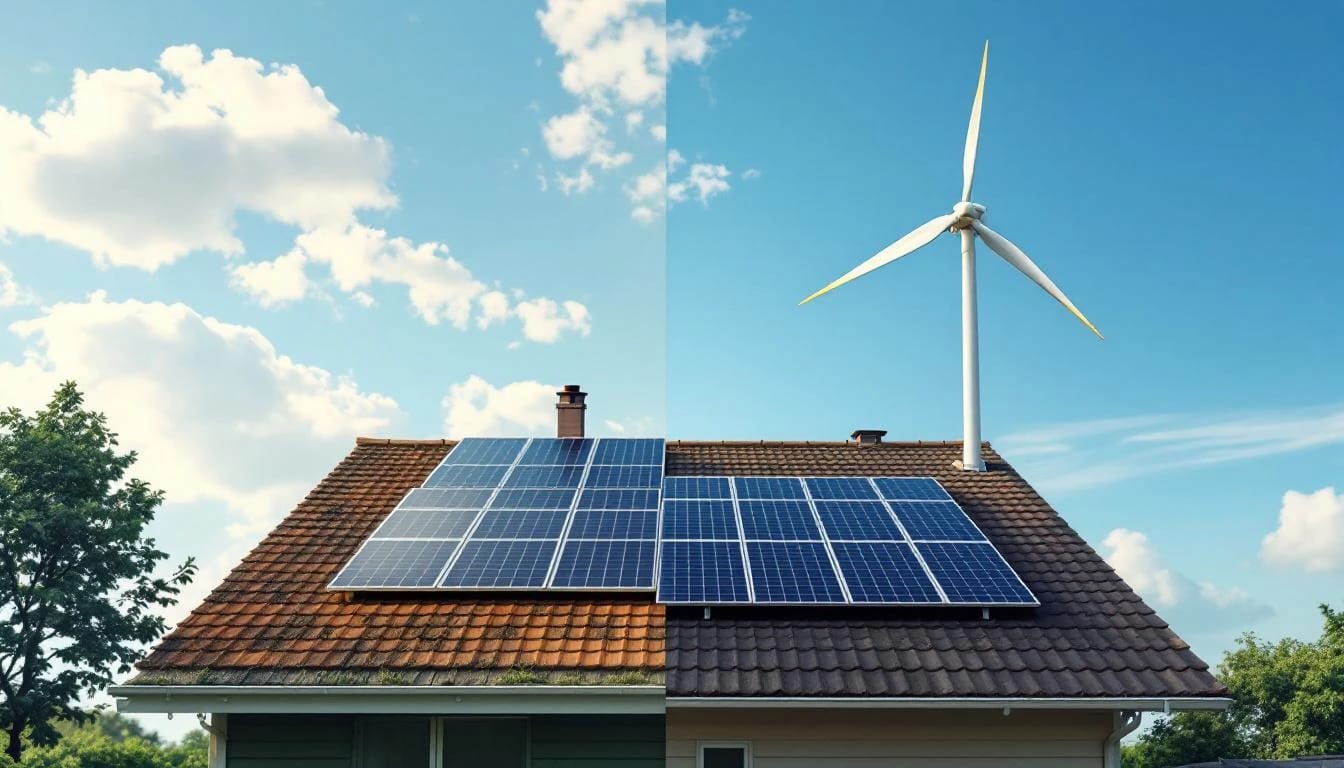
Wind vs Solar for Residential: Which One Wins for Your Site
Wind turbines excel in open, windy sites with consistent 12+ mph winds; solar panels dominate in most suburban settings. Compare costs, energy output, and site requirements.
Share this article
windturbinehome.com/s/ca95f6

Wind turbines perform best on open rural properties with consistent 12+ mph average wind speeds, while solar panels deliver reliable energy in nearly any residential setting with adequate sun exposure. For most suburban homeowners, solar produces 3-5 times more annual energy per dollar invested, but properties with strong, steady wind and relaxed zoning can see wind turbines generate 20-40% of household electricity at competitive costs.
The core trade-off: site specificity vs. universal viability
Solar panels extract energy from a resource that varies predictably by latitude and season. Wind turbines harvest power from a resource that swings wildly across terrain, elevation, and local obstacles. A five-acre property in Iowa with 14 mph annual average winds and minimal tree cover creates conditions where a Bergey Excel 10 can produce 1,500 kWh per month during winter peaks. The identical turbine mounted in a wooded Connecticut suburb with 8 mph winds delivers less than 300 kWh monthly and costs three times as much per kilowatt-hour as rooftop solar.
Solar modules generate power proportional to irradiance—the photon flux hitting the cell surface. A south-facing array in Phoenix captures roughly 7.5 peak-sun hours daily, while the same system in Seattle sees 3.5 hours in winter. The spread is large, but the relationship remains linear and predictable. Wind power scales with the cube of wind speed, meaning a site with 10 mph winds produces only 37% of the energy available at 13 mph. Small changes in wind resource create enormous swings in turbine economics.
The NREL Renewable Resource Data Center maps show wind speeds at 30 meters across the US. Class 2 sites (5.6-6.4 m/s, roughly 12.5-14.3 mph) mark the threshold where residential turbines become financially competitive with grid electricity in markets without heavy subsidies. Class 1 sites (below 5.6 m/s) rarely justify turbine investment outside of off-grid applications where avoiding transmission line extension costs tilts the calculation.
Upfront costs: wind demands more capital per kilowatt
A turnkey 6 kW rooftop solar array in the US averages $15,000-$18,000 before incentives, yielding $2.50-$3.00 per installed watt. The system includes panels, inverter, racking, wiring, and professional installation. The federal 30% Residential Clean Energy Credit (IRC §25D, claimed on IRS Form 5695) reduces net cost to $10,500-$12,600. Many states layer additional rebates through DSIRE-listed programs.
A comparable-capacity small wind turbine—a Bergey Excel 1, Primus AIR 40, or Aeolos-H 5kW—runs $25,000-$35,000 installed on a guyed lattice or monopole tower reaching 80-120 feet. Installation labor represents 40-50% of total cost because crane services, concrete foundation work, and electrical integration require specialized contractors. Tower height directly influences output; raising a turbine from 60 feet to 100 feet can boost production 30-40% by escaping ground turbulence. After the 30% federal credit, net cost lands between $17,500 and $24,500, still double the per-watt expense of solar.
The 30% credit applies to both technologies under the same statute, but wind projects face steeper soft costs. Permitting for turbines involves zoning variance hearings, setback waivers, FAA Part 77 airspace review (any structure exceeding 200 feet AGL near airports), and often acoustic studies. Solar permitting rarely extends beyond a building-department plan check and utility interconnection agreement.
Energy production: wind shines in the right location
A 6 kW solar array in Denver (5.5 peak-sun hours) generates approximately 9,000 kWh annually. The same system in Miami (5.8 hours) reaches 9,800 kWh. A Bergey Excel 1 rated at 1 kW in a Class 3 wind site (14.3-15.7 mph) produces 2,000-2,500 kWh per year. The larger Excel 10 (10 kW rated) yields 15,000-18,000 kWh annually in the same conditions—double the solar output at less than twice the installed cost.
The catch: only 13% of residential properties in the contiguous US meet Class 3 criteria at tower heights affordable for homeowners. Coastal Maine, the Great Plains, and exposed ridgelines in the Rockies concentrate the viable sites. Suburban neighborhoods, wooded valleys, and areas behind terrain features rarely sustain 12 mph average speeds at accessible tower heights.
Solar production degrades 0.5-0.8% annually due to cell aging, but turbines face mechanical wear that accelerates maintenance cycles. Yaw bearings, pitch mechanisms, and slip rings require inspection every 2-3 years. Blade leading-edge erosion in dusty or coastal environments shortens rotor lifespan to 12-15 years versus 25-30 for solar panels. Bearing replacement at year 12-15 costs $2,000-$4,000 for a 5 kW turbine, while solar inverters ($1,200-$1,800) typically last 10-12 years before replacement.
Space and aesthetic considerations
A 6 kW solar array occupies 320-400 square feet of roof or ground area. Flush-mount rooftop installations disappear into the home profile in most neighborhoods. Ground-mount racks require 500-600 square feet including access corridors but stand only 6-8 feet tall.
A residential wind turbine on an 80-foot tower dominates the visual field within a quarter-mile radius. Rotor diameter on a 5 kW unit spans 18-22 feet, creating motion that draws the eye. Blade-tip speed approaches 100 mph in strong winds, producing a rhythmic whoosh audible 200-400 feet downwind. Modern turbines generate 40-50 dB at 100 feet—comparable to light rainfall—but neighbors in quiet rural areas notice the addition. Setback requirements in most jurisdictions mandate 1.1-1.5× tower height from property lines, meaning an 80-foot tower needs 0.5-1 acre minimum lot size.
Homeowners associations and deed restrictions frequently ban wind turbines but permit solar installations. Municipal zoning codes in suburban areas cap tower heights at 35-60 feet, rendering turbines uneconomical by forcing placement in turbulent low-altitude wind. Solar faces fewer regulatory barriers; 27 states have solar-access laws preventing HOAs from blanket solar prohibitions.
Grid integration and net metering
Both technologies connect through inverters compliant with IEEE 1547 and UL 1741 standards. NEC Article 705 governs interconnection for all distributed generation. Most utilities require a production meter separate from the consumption meter, plus an external AC disconnect accessible to utility personnel.
Net metering policies—tracked state-by-state through DSIRE—treat wind and solar identically in 38 states, crediting excess generation at retail rates. The remaining states use avoided-cost rates (wholesale pricing) or impose monthly minimums that penalize intermittent generation. California's NEM 3.0, implemented in April 2023, slashed export credits to $0.05-$0.08/kWh, down from $0.30+/kWh under NEM 2.0. The policy change devastated economics for both wind and solar in the state, though solar's lower installed cost lets it reach breakeven faster.
Wind turbines generate disproportionately during winter when heating loads peak in cold climates. Solar production peaks in summer when cooling dominates in hot climates. A northern Minnesota homeowner heating with resistance electric sees higher value from winter wind generation than from summer solar surplus exported at net-metering rates.
Maintenance realities separate the technologies
Solar panels require hosing off twice annually in dusty environments and inverter replacement every 10-12 years. String inverters cost $1,200-$1,800; microinverter replacement runs $150-$200 per panel. Total 25-year maintenance averages $3,000-$5,000 for a 6 kW system.
Wind turbines demand annual inspections, tower climbing or drone surveys, bolt torque checks, and lubrication. Small horizontal-axis turbines operate at 300-600 RPM at the rotor, amplified to 1,200-1,800 RPM at the generator through a gearbox. Gearbox oil changes occur every 3-5 years ($300-$600). Guy-wire tension adjustments prevent tower fatigue. Vertical-axis turbines (Pikasola, Aeolos-V models) eliminate yaw mechanisms but introduce complex bearing loads that concentrate wear at the base shaft.
A realistic 25-year maintenance budget for a 5 kW wind turbine totals $12,000-$18,000, including one bearing overhaul, two blade-tip repairs, and three gearbox services. Owner-performed maintenance cuts costs 40-50% for mechanically inclined homeowners comfortable working at height or contracting tower climbers directly.
Hybrid systems: combining resources
Properties with moderate wind (Class 2) and good solar access often achieve lower total cost and higher reliability by installing both technologies. A 3 kW turbine paired with a 4 kW solar array diversifies generation across time-of-day and seasonal patterns. Winter wind fills the gap when solar production drops, while summer solar carries the load when turbines idle during calm weeks.
Hybrid inverters from Schneider Electric, OutBack Power, and SMA integrate both DC solar strings and AC wind output into a single battery bank for off-grid applications. Grid-tied hybrids use separate grid-interactive inverters for each source, meeting NEC 705.12(D) requirements for multiple interconnected sources. Total installed cost for the hybrid system described runs $35,000-$45,000 before incentives, landing between a large solar-only system and a wind-only installation.
The configuration works best when property characteristics naturally suit both: open southern exposure for panels, elevated terrain or cleared land for turbine placement. Wooded sites with small clearings rarely justify the hybrid expense because shading losses on solar and turbulent wind at low tower heights undermine both systems.
The permitting and installation timeline gap
Solar installations proceed from contract signature to energization in 6-10 weeks in streamlined permitting jurisdictions. Roof-mount projects in states with statewide solar codes (California, Massachusetts, New Jersey) often complete in 4-6 weeks. Ground-mount systems require septic setback verification and sometimes wetland delineation, adding 2-4 weeks.
Wind turbine projects stretch 4-9 months from application to commissioning. Zoning variance hearings occur monthly in most municipalities, consuming 2-3 months before approval. Foundation engineering requires geotechnical boring to confirm soil bearing capacity for concrete piers (5-8 cubic yards per foundation). Tower delivery lead times from manufacturers extend 8-12 weeks. Crane rental scheduling for turbine lifting—requiring 50-70 ton capacity for tilt-up towers—depends on regional availability. A project starting in April reaches completion in late summer at best, mid-fall typically.
FAA Part 77 airspace review adds 6-8 weeks when towers exceed 200 feet above ground level or sit within glide path zones near airports. The online FAA Notice Criteria Tool flags properties requiring formal review. Turbines receiving a "Determination of No Hazard" may still need obstruction lighting if located in approach paths, adding $2,500-$4,000 in equipment and monthly electric costs.
Financial payback in real-world scenarios
A suburban Kansas City homeowner installing a 6 kW solar system for $16,000 net (post-30% credit) consumes 900 kWh monthly and pays $0.13/kWh. The system produces 850 kWh monthly on average, offsetting $111 per month. Simple payback occurs in 12 years; the system generates positive cash flow over a 25-year life.
A rural Wyoming property with 13.5 mph average winds installs a Bergey Excel 10 for $32,000 ($22,400 net after credit). The turbine produces 1,400 kWh monthly, offsetting $182/month at $0.13/kWh. Payback stretches to 10.3 years, slightly better than the solar scenario despite higher upfront cost. After 25 years, cumulative savings reach $38,000, but one major overhaul ($6,000) and higher maintenance expenses reduce net benefit to $24,000 versus $30,000 for solar.
A low-wind Connecticut site (9 mph average) sees a 5 kW Primus turbine at $28,000 net produce only 450 kWh monthly, worth $58. Payback extends beyond 40 years—the turbine never recovers its cost. The same $28,000 invested in a 9 kW solar array produces 900 kWh monthly and pays back in 11 years.
When wind makes sense
Wind turbines win the economic comparison when four conditions align:
Annual average wind speed exceeds 12 mph at affordable tower heights. Anemometer data logging over 12 months confirms resource. Relying on NREL maps alone introduces 20-30% uncertainty.
Property size supports setbacks. One acre minimum for 60-80 foot towers; 2+ acres for 100-foot installations. Rural agricultural zoning typically permits wind; suburban residential rarely does.
Utility net metering values winter production. Northern climates with electric heating and unfavorable time-of-use rates for summer solar exports tilt calculation toward wind.
Owner accepts maintenance responsibility. Mechanical aptitude and willingness to manage service intervals or budget $500-$800 annually for contractor inspections determine long-term satisfaction.
Off-grid applications shift economics dramatically in wind's favor when property sits more than 0.5 miles from existing utility lines. Grid extension costs $25,000-$50,000 per mile; a hybrid wind-solar-battery system pencils out below that threshold even with higher maintenance.
When solar dominates
Solar panels deliver superior economics in:
Suburban and urban residential settings. Zoning permits solar; HOAs increasingly cannot block installations under state solar-access laws. Roof-mount systems avoid land-use conflicts.
Low-to-moderate wind sites (Class 1, Class 2). Covering 65% of US residential land area, these locations see wind turbines produce 40-60% less energy per dollar than solar.
Properties prioritizing low maintenance. Homeowners leaving for months at a time or aging in place favor solar's set-and-forget operation.
States with strong solar incentives. Massachusetts SMART program, New York megawatt block, and Maryland SREC markets add $3,000-$8,000 value to solar projects. Few states offer wind-specific residential incentives beyond the federal credit.
Grid-tied applications with reliable utility service and retail-rate net metering heavily favor solar's lower cost, faster installation, and negligible maintenance. Battery backup additions (10-20 kWh storage for $8,000-$14,000) provide outage protection without turbine complexity.
Comparing the best performers
| Feature | Bergey Excel 10 (Wind) | Primus AIR 40 (Wind) | 6 kW Solar Array |
|---|---|---|---|
| Rated capacity | 10 kW | 6 kW | 6 kW |
| Installed cost (net) | $24,000-$28,000 | $18,000-$22,000 | $10,500-$12,600 |
| Annual output (Class 3 wind / 5.5 sun-hr) | 16,000 kWh | 9,500 kWh | 9,000 kWh |
| Cost per kWh (25-year) | $0.09-$0.11 | $0.11-$0.14 | $0.05-$0.07 |
| Maintenance (25-year) | $15,000 | $12,000 | $4,000 |
| Lifespan | 20-25 years | 18-22 years | 25-30 years |
| Tower/mounting | 80-100 ft guyed | 60-80 ft monopole | Roof/ground 8 ft |
Numbers assume Class 3 wind site for turbines; solar output based on Denver irradiance. Installation includes all labor, materials, permits, and interconnection.
For additional context on small wind performance, see small wind turbine efficiency ratings and residential wind turbine cost breakdown. Homeowners considering solar should review solar panel efficiency comparisons and net metering policies by state.
The hybrid path for borderline sites
Class 2 sites (11-13 mph average) occupy a gray zone where neither technology dominates. A 2 kW turbine ($12,000-$16,000 net) paired with a 4 kW solar array ($7,000-$8,400 net) produces 11,000-13,000 kWh annually for $19,000-$24,400 total investment. The hybrid matches a 6 kW solar array's output in many climates while adding winter generation security.
The split system costs 60-80% more than solar alone but provides 30-40% more annual energy in favorable wind sites. Payback extends to 13-16 years, acceptable for homeowners prioritizing energy independence and resilience over pure financial return. Battery integration (adding $10,000-$14,000) creates a microgrid capable of 3-5 days backup during grid outages, valuable in areas with unreliable utility service.
Hybrid systems require careful load management. Inverter sizing must accommodate simultaneous peak output from both sources—a rare event, but NEC 705 requires design for maximum potential backfeed. A 4 kW solar inverter and 2 kW wind inverter feeding a 200-amp service panel needs junction box combining and proper breaker sizing per 705.12(B) rules. Licensed electricians familiar with distributed generation prevent code violations that void utility interconnection agreements.
Explore hybrid wind-solar system design and battery backup for renewable energy for detailed integration guidance.
Noise, wildlife, and shadow flicker
Wind turbines generate 40-50 dB acoustic output at 100 feet during operation, rising to 55-60 dB in high winds. Blade-tip vortex shedding creates a rhythmic whoosh some neighbors find intrusive, others barely notice. Upwind turbines (rotor facing into wind) produce less noise than downwind designs. Direct-drive generators (no gearbox) eliminate gear whine, lowering acoustic signature 5-10 dB.
Bird and bat strikes occur at rates of 2-5 per turbine annually for residential units, far below utility-scale turbine impacts but still a concern for property owners valuing wildlife. Raptors hunting in open fields learn to avoid rotating blades; migratory songbirds face higher collision risk during spring and fall movements. Bat fatalities peak in late summer when juveniles disperse. Installing turbines away from treelines and water sources reduces mammal and avian conflicts.
Shadow flicker—the strobing effect when sun, rotor, and viewer align—affects properties within 10 rotor diameters of the turbine for 20-60 minutes daily during certain sun angles. A 20-foot rotor creates flicker zones extending 200 feet. Setbacks prevent flicker from reaching neighbor homes, but sheds, gardens, and outdoor living spaces on the owner's property may experience the effect. Software modeling during siting predicts flicker paths; rotating the turbine 15-30 degrees off-axis from neighboring structures mitigates most complaints.
Solar panels produce no noise, minimal wildlife impact (occasional bird nesting under arrays), and no flicker. Ground-mount systems create pollinator habitat underneath when vegetated with native wildflowers. Roof-mount arrays occasionally attract nesting pigeons, requiring one-time mesh screening installation ($200-$400).
Insurance and liability considerations
Homeowners insurance policies require disclosure of wind turbine installations. Premiums increase $150-$400 annually to cover tower collapse, blade throw, and liability for off-property damage. Umbrella policies ($1-2 million coverage) add another $200-$300 annually for properties with turbines exceeding 60 feet.
Solar arrays on roofs rarely trigger premium increases when installed by licensed contractors; insurers view them as permanent fixtures similar to HVAC equipment. Ground-mount solar may add $50-$100 annually due to vandalism and theft exposure. Comprehensive coverage riders protect against hail damage (common in the Great Plains) for $100-$150 per year per $10,000 of solar system value.
Both systems require independent electrical inspections meeting NEC Article 705 interconnection standards. Local code enforcement signs off on final installation before utility permission-to-operate grants. Wind turbine structural engineering stamped by a professional engineer (PE) licensed in the installation state prevents tower collapse liability and validates permit applications. Solar projects under 10 kW rarely need PE review except in high-seismic or wind-load zones.
Additional resources on risk management include homeowners insurance for wind turbines and solar panel hail damage protection.
Can I install both wind and solar on the same property?
Yes, hybrid systems combining wind and solar operate under the same NEC Article 705 interconnection rules. The systems require separate inverters feeding a common service panel or AC combiner box. Total backfeed current cannot exceed panel bus rating (typically 200 amps for residential), calculated using the 120% rule in NEC 705.12(D). A licensed electrician designs the junction configuration, and the utility reviews the interconnection application for compliance. Properties with strong wind and good solar access see hybrid systems produce 40-60% more annual energy than single-source installations at 50-70% higher cost.
What wind speed do I need to make a turbine worthwhile?
Annual average wind speeds of 12 mph or higher at turbine hub height (typically 80-100 feet) mark the threshold where small wind turbines compete economically with grid electricity and solar panels. Sites with 10-11 mph averages remain marginally viable in areas with expensive electricity ($0.18+/kWh) or poor solar resources. Wind speed cubes into power output—moving from 10 mph to 13 mph triples energy production. Anemometer data logging for 12 months at proposed tower height provides the only reliable resource confirmation; NREL maps carry 20-30% uncertainty.
How long do wind turbines last compared to solar panels?
Solar panels carry 25-30 year warranties and maintain 80-85% output at end of life with minimal maintenance. Wind turbines last 20-25 years with proper maintenance but require bearing replacements, gearbox overhauls, and blade refurbishment at 12-15 year intervals. Total lifetime maintenance costs for wind run 3-4× higher than solar ($12,000-$18,000 versus $3,000-$5,000 for a similarly sized system). Turbines face mechanical fatigue from continuous rotation, while solar panels degrade slowly through UV exposure without moving parts.
Do wind turbines work in suburban neighborhoods?
Turbines perform poorly in suburban settings due to low tower heights (restricted by zoning to 35-60 feet), turbulent airflow from buildings and trees, and neighbor opposition. Ground-level turbulence reduces output 50-70% compared to open rural sites. Setback requirements (1.1-1.5× tower height from property lines) prevent adequate separation on typical quarter-acre suburban lots. Solar panels deliver 5-8× better energy return per dollar in suburban locations, face fewer permitting barriers, and avoid noise complaints. Wind turbines belong on rural properties with 1+ acre of open land and favorable zoning.
Does the 30% federal tax credit work the same for wind and solar?
Yes, IRC §25D provides a 30% Residential Clean Energy Credit for both wind and solar installations through 2032, stepping down to 26% in 2033 and 22% in 2034. The credit applies to equipment, labor, permitting, and interconnection costs. Homeowners claim the credit on IRS Form 5695 filed with their annual tax return. The credit reduces tax liability dollar-for-dollar but does not create a refund if credit exceeds tax owed (non-refundable credit). Unused credits carry forward to subsequent tax years. Both systems qualify for accelerated depreciation under IRS rules when installed at home-based businesses.
Bottom line
Solar panels win the residential renewable energy competition in 85% of US properties due to lower cost, faster installation, minimal maintenance, and broad zoning acceptance. Wind turbines deliver competitive or superior economics only on rural sites with sustained 12+ mph winds, relaxed setbacks, and owners willing to manage maintenance. Properties meeting wind's narrow requirements often benefit from hybrid wind-solar systems that diversify generation across seasons and weather patterns. Run a professional site assessment before committing to wind; default to solar when wind resource or zoning remains uncertain.
Request quotes from three licensed installers for any system type, verify DSIRE incentives in your state, and confirm net metering rates with your utility before finalizing technology choice.
Share this article
windturbinehome.com/s/ca95f6
Editorial note: This article was researched and written by a member of the Wind Turbine Home editorial team. AI-assisted tools were used for spell-checking and light grammar review only — all research, analysis, and conclusions are our own. Our editorial policy prohibits sponsored content and paid placements. Read our editorial policy →
Related reading
wind vs solar
Cost per kWh: Wind vs Solar at Residential Scale in 2025
Residential wind costs $0.18–$0.42/kWh versus solar's $0.06–$0.14/kWh when averaged over 20 years. Site wind speed and roof versus tower installation drive the difference.
wind vs solar
Home Wind Turbine vs Propane Generator: Lifetime Cost Compared
A 5kW home wind turbine costs $25,000–$40,000 installed but pays back in 8–15 years. A propane standby generator costs $6,000–$12,000 but burns $1,500–$3,000 in fuel yearly.
wind vs solar
Wind Turbine vs Solar for an RV: Which Actually Wins on the Road
Solar panels dominate stationary RV camping with 400W systems under $800, but wind turbines shine during stormy weather and overnight charging in windy sites.
wind vs solar
Wind Turbine vs Generator for Backup Power: Cost & Runtime
Wind turbines deliver unlimited runtime but need wind and large upfront costs. Generators offer instant power for $500-4,000 but require fuel. Compare costs, reliability, and when each works best.
wind vs solar
Wind Turbine vs Solar for an Off-Grid Cabin: Which Powers Best?
Wind turbines excel in winter and forested sites, while solar panels dominate summer and desert cabins. Most off-grid setups combine both for year-round power.
wind vs solar
Do Wind Turbines Work at Night? Power Generation After Dark
Wind turbines generate electricity 24/7 whenever wind blows, including at night. Unlike solar panels, small wind systems often produce more power after sunset.
wind vs solar
Home Wind Turbine vs Solar Panels: Which Wins for Your Site
Compare wind turbines and solar panels for residential power. Learn which renewable option delivers better ROI based on your property's wind speed, sun hours, and budget.