How to Measure Wind Speed at Your Property Before You Buy
Learn proven methods to assess wind resources on your property using anemometers, data loggers, and free tools—so you know if a turbine investment makes sense.
Share this article
windturbinehome.com/s/ad09ca
Measuring wind speed at your property for at least 12 months with an anemometer mounted at hub height is the most reliable way to determine whether a small wind turbine will deliver adequate return on investment. The Department of Energy's WINDExchange program recommends collecting site-specific data because wind resources vary dramatically over short distances—a ridge 200 feet away may experience 25% more average wind than your building location. One year of on-site measurement removes guesswork and informs turbine sizing, tower height decisions, and realistic payback calculations.
Why measuring wind speed matters before committing to a turbine
Small wind turbines only become cost-effective when average annual wind speeds exceed approximately 10 mph (4.5 m/s) at hub height. Below that threshold, energy production drops exponentially. Bergey Windpower, one of the oldest U.S. manufacturers, states that turbines in Class 2 wind regimes (5.6–6.4 m/s) can still work economically on the right sites, but turbines in locations below 5 m/s rarely pay for themselves within their 20-year design life.
Regional wind maps—even high-resolution versions from the National Renewable Energy Laboratory—cannot account for hyper-local terrain features. A gully, tree line, or building can create wake turbulence that slashes production by 30–50%. On-site measurement catches these realities before money leaves the bank account.
Wind speed measurement also satisfies diligence requirements for financing and utility interconnection. Some lenders and rebate programs require verified wind data. In states with performance-based incentives listed on the DSIRE database, documented wind speeds can influence incentive tier eligibility.
Free and low-cost assessment tools: where to start
The Department of Energy's WINDExchange site offers the National Wind Resource Maps and county-level wind atlases. These tools provide 80-meter resolution data—not property-specific, but useful for initial go/no-go screening. If your county shows Class 1 wind (below 4.5 m/s annual average), further investigation may not be justified unless you occupy a known high-wind microclimate like a coastal bluff or mountain pass.
The AWS Truepower wind map layers in NREL's Wind Prospector tool allow users to zoom to neighborhoods and see modeled wind speeds at 30, 50, 80, and 100 meters. These models incorporate terrain roughness and elevation but still generalize. They answer the question "Is my region promising?" not "Will my backyard support a 10 kW turbine?"
For a quick physical check, observe flag behavior and tree growth. Flags that flutter daily and deciduous trees with crowns flagged to one side suggest Class 3 or better wind. Agricultural extension offices in plains states sometimes maintain historical anemometer records from nearby farms; a phone call can uncover decade-old data sets.
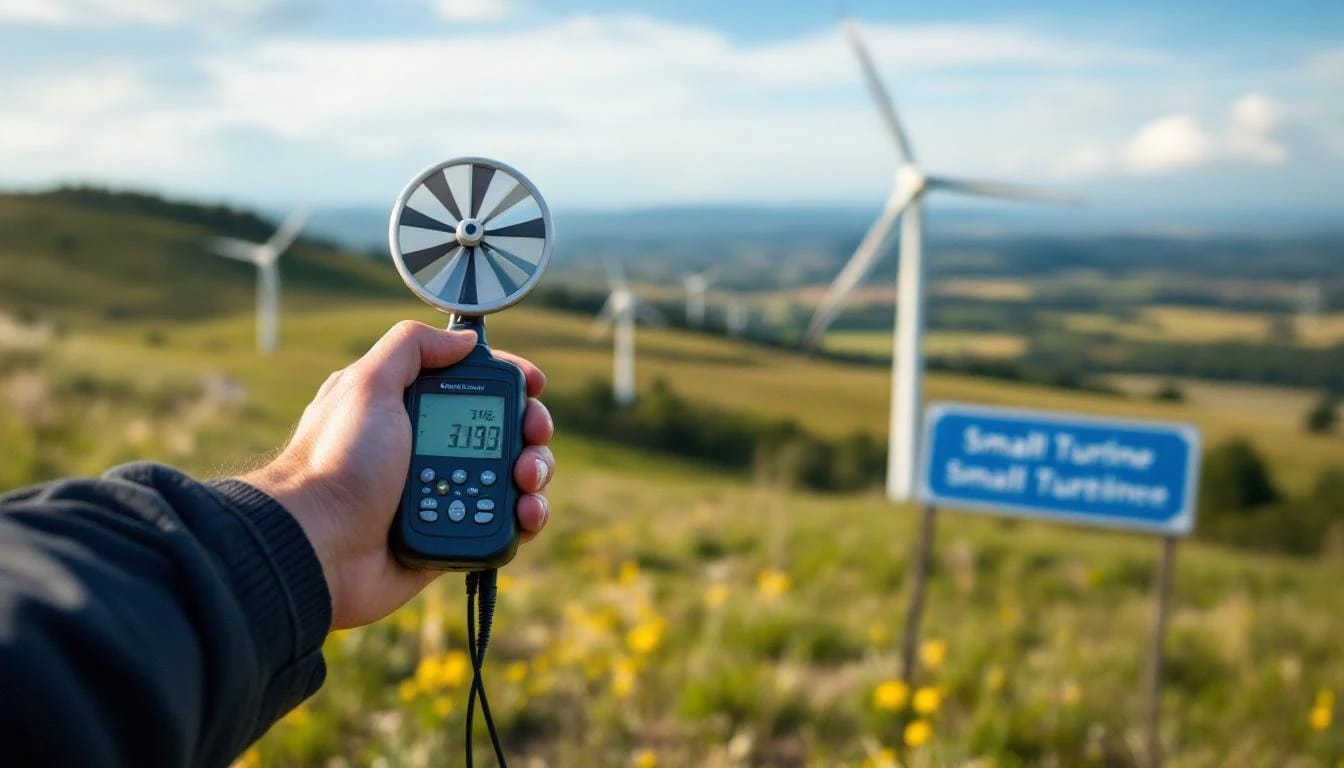
Using a handheld anemometer for spot checks
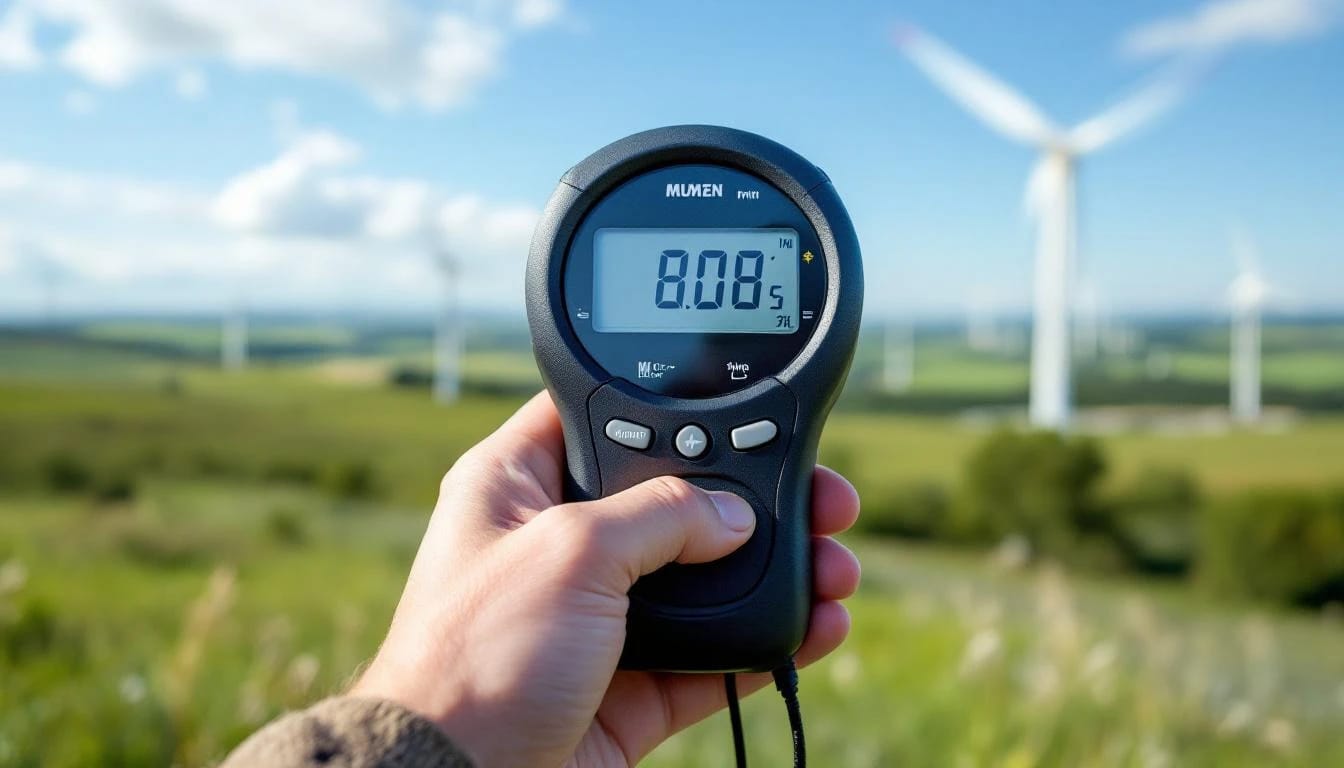
Handheld cup or vane anemometers cost $30–$150 and measure instantaneous wind speed. Kestrel and Proster offer consumer models with wind-speed averaging over 30-second or 1-minute intervals. These devices help identify wind direction patterns and verify whether afternoon thermals arrive as predicted by topography.
Handheld readings have strict limits. Taking ten 1-minute samples on a breezy Saturday afternoon does not represent annual conditions. Wind speeds vary by season, time of day, and weather system. A single day's data captures less than 0.3% of the annual wind regime.
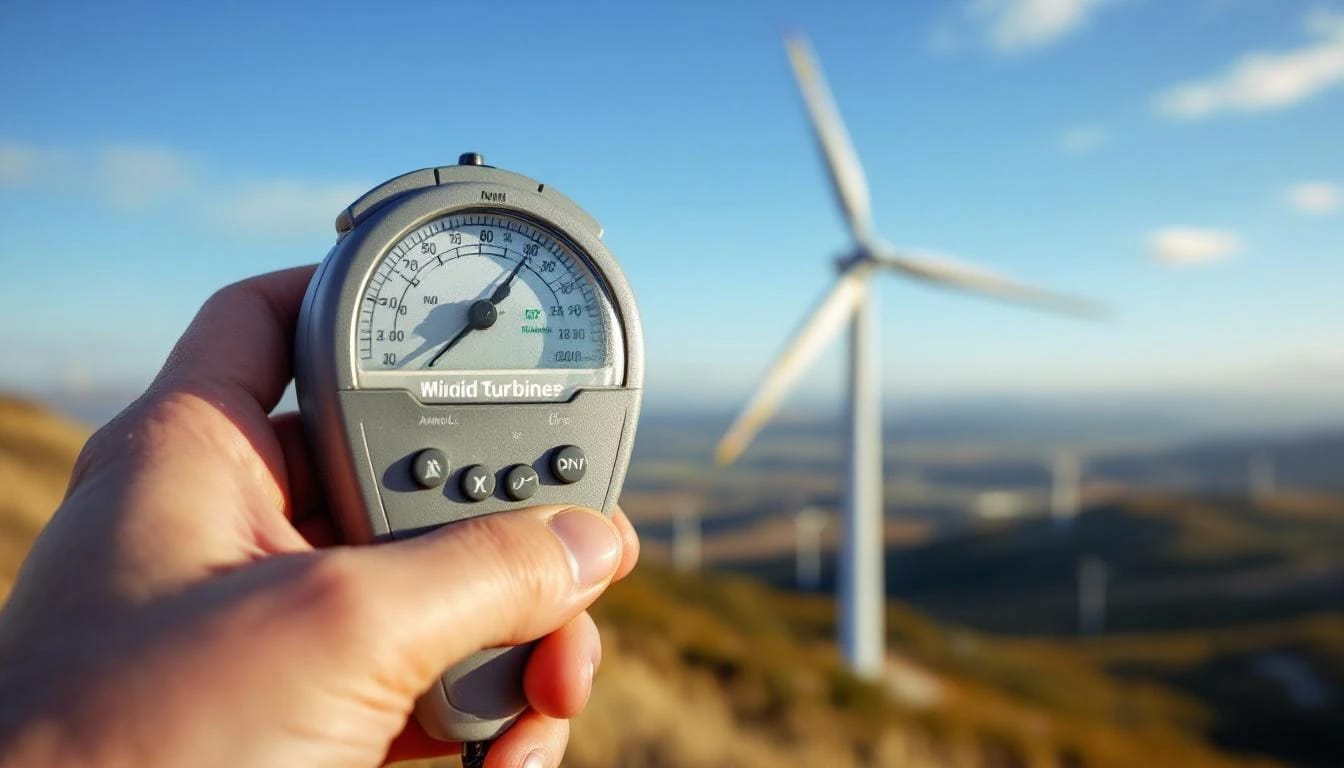
Best practice for handhelds: take readings at multiple times (dawn, midday, dusk) across different seasons and compare results to the nearest airport METAR wind data. If handheld readings consistently match or exceed the airport's reported speeds, the site may have favorable exposure. If readings fall short, local obstructions are likely present.
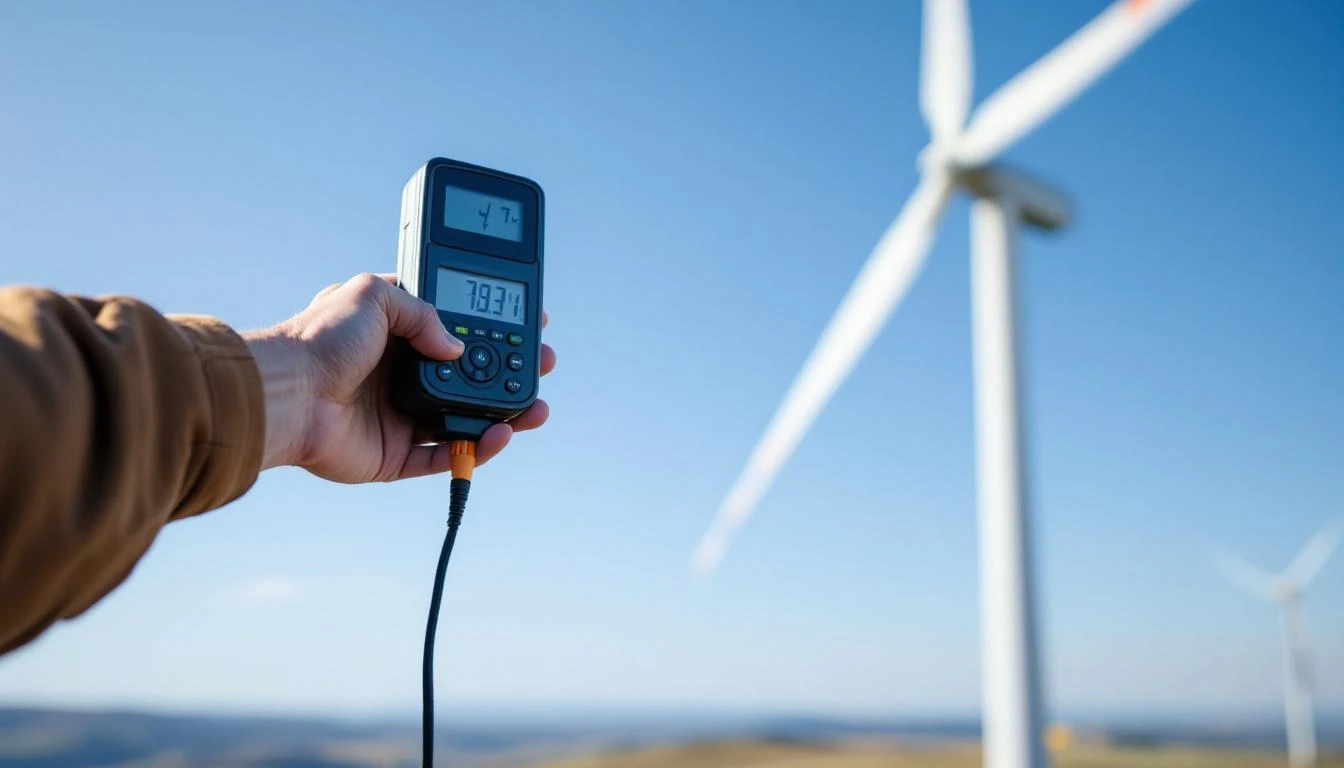
Installing a data-logging anemometer: the gold standard
A data-logging anemometer mounted on a tower or mast at the proposed turbine hub height delivers bankable data. The WINDExchange Small Wind Guidebook states that anemometer height should match the planned turbine hub height—typically 30 to 120 feet for residential systems—because wind speed increases with height according to wind shear exponent (often 0.14–0.20 over open terrain, higher in suburban areas).
Equipment needed:
- Cup anemometer with pulse or voltage output (NRG #40C, Inspeed Vortex, or Davis Instruments 6410)
- Data logger capable of 10-minute averaging (Onset HOBO, NRG Symphonie, or Campbell Scientific CR300)
- Telescoping mast or guyed lattice tower rated for ice and wind loads per ASCE 7
- Power supply: solar panel with battery or hard-wired AC if available
- Guy anchors, turnbuckles, and grounding per NEC Article 250
Installation height matters more than most realize. A 30-foot test mast may show 8 mph average wind, while the same site at 80 feet yields 11 mph—a difference that triples turbine output. Mount the sensor at the exact height the turbine hub will occupy or apply a wind shear correction formula afterward.
Data loggers should record at 10-minute intervals for a minimum of 12 months. Shorter periods miss seasonal variation; spring and winter often deliver higher wind than summer and fall in temperate climates.
Local electrical codes apply to data logger installations. If the mast exceeds 20 feet, NEC Article 705 interconnection rules may require a licensed electrician to supervise grounding and bonding. FAA Part 77 does not typically require lighting or notification for measurement masts below 200 feet, but proximity to airports can change that—check the FAA's online notice tool before erecting any tower.
Reading and interpreting your wind data
After 12 months of logging, download the data and calculate the mean wind speed, wind speed distribution (often presented as a Weibull probability distribution), and prevailing wind direction. Bin the data into 1 m/s increments to reveal the proportion of time the wind blows at each speed range.
A hypothetical data set might show:
| Wind Speed Range (m/s) | Percentage of Year |
|---|---|
| 0 – 3 | 22% |
| 3 – 5 | 31% |
| 5 – 7 | 24% |
| 7 – 10 | 15% |
| 10+ | 8% |
This distribution indicates a Class 2 resource (average around 5.5 m/s or 12.3 mph). A 5 kW turbine rated at 11 m/s would operate below rated output most of the year, and a 10 kW turbine would produce even less efficiently. Downsizing to a 2.5 kW model with a lower rated speed might yield better capacity factor.
Turbulence intensity is another critical metric. High turbulence—above 15%—accelerates wear on blades and bearings. Turbulence arises from obstacles within 500 feet and from complex terrain. If data reveals high turbulence, consider relocating the turbine or increasing tower height to escape ground-level disturbances.
Prevailing direction informs siting. Position the turbine upwind of buildings and avoid placement downwind of tree belts. A bimodal wind rose (two dominant directions) may complicate siting but does not disqualify a location.
Correlating your data with long-term records
Twelve months of on-site data might coincide with an unusually calm or windy year. To adjust for year-to-year variation, correlate your measurements with the nearest long-term airport weather station (20+ years of data). Calculate the ratio between your site's average and the airport's average during your measurement period, then apply that ratio to the airport's long-term mean.
Example: Your site averaged 5.8 m/s during 2024. The nearby airport averaged 4.2 m/s in 2024 but has a 25-year mean of 4.5 m/s. The ratio is 5.8 ÷ 4.2 = 1.38. Long-term estimate for your site: 4.5 × 1.38 = 6.2 m/s.
This technique, called measure-correlate-predict (MCP), reduces single-year sampling error and produces a more reliable basis for financial modeling.
Estimating annual energy production from wind speed data
Once you have a quality-controlled, long-term-adjusted mean wind speed, use turbine power curves to estimate annual kilowatt-hour production. Every manufacturer publishes a power curve showing output at wind speeds from cut-in (typically 2.5–3.5 m/s) through rated speed (10–14 m/s) to cut-out (20–25 m/s).
Generic estimation formula:
AEP (kWh/year) ≈ 0.01328 × D² × V³ × Capacity Factor
where D is rotor diameter in feet, V is average wind speed in mph, and capacity factor is typically 0.15–0.30 for small turbines in Class 2–4 winds.
For example, a Bergey Excel 10 (10 kW nameplate, 7-foot diameter blades) in 11 mph average wind might produce:
0.01328 × 7² × 11³ × 0.22 ≈ 1,850 kWh/year
Compare that to your household consumption. If you use 12,000 kWh annually, this turbine would offset roughly 15% of your load—a meaningful but partial contribution.
Most manufacturers offer online calculators that accept your measured wind speed and return estimated production. Cross-check those estimates against independent tools like the Small Wind Turbine Performance Calculator maintained by NREL.
When professional wind assessment makes sense
Residential wind assessment costs $2,000–$5,000 for a turnkey 12-month campaign with report. Professional services include tower rental, installation, data quality control, MCP analysis, turbulence characterization, and siting recommendations.
Consider hiring a consultant if:
- The turbine investment exceeds $25,000
- Local terrain is complex (ridges, canyons, coastal slopes)
- Financing or rebate programs require third-party verification
- Multiple turbine locations must be compared
- Neighbors or zoning boards demand documented evidence
The American Wind Energy Association (now the Clean Power Alliance) maintains a list of certified small wind site assessors. Some states offer wind assessment grants or subsidized anemometer loans through DSIRE-listed programs; check your state energy office.
Common mistakes that skew results
Mounting the anemometer on a building rooftop seems convenient but introduces massive error. Airflow over roof peaks accelerates and swirls; rooftop data can overestimate or underestimate hub-height wind by 20–40% depending on building geometry. Always mount on a freestanding mast at the proposed hub height.
Recording fewer than 12 months misses seasonal peaks. Spring wind in the Great Plains often doubles summer wind. Coastal sites see winter storms that drive annual averages. A six-month summer-fall campaign will understate resource quality.
Ignoring anemometer calibration drift is another pitfall. Cup anemometers lose 1–3% accuracy per year as bearings wear. Send the unit for annual calibration or replace low-cost consumer models every two years.
Using a single measurement height and extrapolating to hub height with generic shear exponents introduces 10–15% uncertainty. If budget allows, mount two anemometers—one at 30 feet, one at 60 feet—to calculate site-specific shear.
Integrating wind data into turbine selection
Once annual energy production estimates are in hand, model the economics. The federal Investment Tax Credit under IRC §25D allows homeowners to claim 30% of turbine and installation costs (including the tower and electrical work) on IRS Form 5695, subject to certain restrictions. Some states add rebates; California's SGIP, New York's NY-Sun, and Massachusetts' SMART program have historically included small wind, though eligibility and rates change.
Calculate simple payback:
(Net system cost after incentives) ÷ (Annual kWh production × Retail electricity rate)
If payback exceeds 15 years, the project may not compete with grid electricity unless rates rise significantly or the household values energy independence for non-financial reasons.
Compare the measured wind resource to manufacturer-specified minimum recommendations. Primus Windpower suggests at least 11 mph (5 m/s) average for their Air 40 and Air X models. Bergey's Excel series performs acceptably down to 10 mph (4.5 m/s) but shines in 12+ mph sites. A measured 9 mph average should prompt reconsideration or a switch to solar photovoltaics, which do not require minimum resource thresholds beyond adequate sun hours.
Vertical-axis turbines like some offerings from Aeolos or Pikasola tolerate higher turbulence and lower wind speeds in theory, but real-world capacity factors remain modest. Measurement data helps set realistic expectations rather than relying on optimistic manufacturer claims.
Tools and resources for ongoing monitoring
After turbine installation, some owners leave the data logger in place to verify performance against predictions. Discrepancies between measured wind and actual turbine output can indicate maintenance issues—dirty blades, yaw bearing friction, inverter faults—that would otherwise go unnoticed until annual inspections.
Online platforms like PVOutput and Open Energy Monitor (originally for solar) now accommodate wind data. Uploading production logs builds a public dataset and allows comparison to peer systems.
Local colleges and universities with meteorology or renewable energy programs sometimes offer free or low-cost anemometer loans and student-led site assessments as course projects. Cooperative extension offices in wind-rich states (Kansas, Oklahoma, Montana, North Dakota) maintain anemometer lending libraries funded by USDA Rural Development grants.
How long should I measure wind speed before buying a turbine?
Measure for a minimum of 12 consecutive months to capture seasonal variation. The Department of Energy's Small Wind Guidebook recommends a full year at hub height. Shorter periods introduce significant uncertainty, especially in climates with pronounced seasonal wind patterns. Professional assessments sometimes extend to 18 or 24 months if the first year coincides with unusual weather.
Can I use smartphone apps or weather station data instead of an anemometer?
Smartphone anemometer apps rely on device microphones and are wildly inaccurate. Weather station data from airports or nearby homes provide context but rarely reflect your specific site's wind regime. Terrain, elevation differences of even 50 feet, and local obstructions create wind speed variations that only on-site measurement captures. Use regional data for initial screening, then commit to site-specific logging before any purchase decision.
What wind speed justifies investing in a small turbine?
An annual average of 10 mph (4.5 m/s) at hub height is the practical minimum for cost-effective operation. At 9 mph, turbines spend too much time below cut-in speed. At 12 mph (5.4 m/s) or higher, production jumps because power output scales with the cube of wind speed—a small increase in average wind yields disproportionate energy gains. Sites below 9 mph almost always favor solar photovoltaics or grid electricity.
Do I need a building permit to install a measurement mast?
Many jurisdictions treat anemometer masts under the same zoning and permitting rules as small wind turbines themselves if the mast exceeds 35 feet. Check local ordinances; some municipalities allow temporary structures for assessment purposes without full permitting if they remain less than 90 days. For 12-month campaigns, expect permit applications, setback compliance (often 1.1× height from property lines), and possible neighbor notification. NEC-compliant grounding is required in all cases.
Should I hire a consultant or do the measurement myself?
DIY measurement with a quality data logger and anemometer costs $800–$1,500 in equipment plus labor. Competent homeowners with basic electrical and construction skills can install a guyed 40-foot mast safely. Hiring a consultant adds $2,000–$4,000 but includes professional siting advice, liability coverage, and a formal report that lenders and utilities accept without question. If the turbine investment exceeds $20,000, the consultant fee is typically justified by risk reduction.
Bottom line
Measuring wind speed on your property for at least one year removes guesswork and prevents costly mistakes. A data-logging anemometer at hub height, combined with long-term correlation to nearby weather records, delivers the foundation for realistic energy production estimates and financial modeling. Skip the measurement phase, and the turbine may underperform for two decades—or a careful assessment might reveal that your site, despite hopeful appearances, belongs to solar panels instead. The few thousand dollars and months of patience invested in quality wind data pay dividends in confidence and long-term return on investment.
how-much-wind-do-you-need-for-turbine
choosing-the-right-tower-height-small-wind
vertical-axis-vs-horizontal-axis-turbines
understanding-small-wind-turbine-power-curves
federal-tax-credits-small-wind-2024
diy-wind-turbine-installation-vs-professional
small-wind-zoning-permits-property-lines
Share this article
windturbinehome.com/s/ad09ca
Editorial note: This article was researched and written by a member of the Wind Turbine Home editorial team. AI-assisted tools were used for spell-checking and light grammar review only — all research, analysis, and conclusions are our own. Our editorial policy prohibits sponsored content and paid placements. Read our editorial policy →
Related reading
wind resource assessment
Weibull Distribution for Wind Energy: What k and c Actually Mean
Learn how Weibull k (shape) and c (scale) parameters define your site's wind profile and predict small turbine output. Real examples from 5-10 kW installations included.
wind resource assessment
Wind Shear Formula for Hub Height: Extrapolating Ground Data
Learn the power law wind shear formula to extrapolate 10m ground measurements to your turbine hub height. Includes coefficients, worked examples, and error ranges.
wind resource assessment
Wind Turbine Swept Area: Calculate Rotor Size & Power Output
Swept area determines how much wind energy a turbine can capture. Learn the formula, why rotor diameter matters more than blade count, and how to size a system.

wind resource assessment
How To Read the DOE WindExchange Map for Your Address (2025)
The DOE WindExchange map shows wind speed at your home—but only if you decode hub height, filter layers, and match your turbine class. Here's the exact process.

wind resource assessment
Do Wind Turbines Work in Low Wind Areas? Performance Analysis
Small wind turbines need minimum 9-10 mph average wind to generate meaningful power. Low-wind sites under 8 mph often produce 30-40% of rated output, making payback periods exceed 25 years.
wind resource assessment
How Much Wind Do You Need for a Home Wind Turbine?
Home wind turbines need average wind speeds of 10+ mph (Class 2) to generate meaningful power. Most residential sites require 9-12 mph sustained winds to justify investment.